Time-series ETL with Meerschaum
Meerschaum is a lightweight time-series ETL system for data scientists built with quality-of-life in mind.
Notes from Industry
Time-series ETL with Meerschaum
Data engineering doesn’t need to be so complicated
I’m Bennett Meares, the author behind Meerschaum. I built and open-sourced Meerschaum to make data engineering more accessible, and this year I completed my master’s thesis on synchronization strategies for using Meerschaum in the real world.
If Meerschaum has helped you with your projects or if you have questions, please let me know on the project discussions board!
Everyday it seems like there’s a new ETL / ELT framework that promises the world. The truth is, the data engineering rabbit hole runs deep. For data scientists and BI analysts, time spent fussing with shoddy scripts or learning bulky frameworks is less time spent on actual analysis. Oftentimes, all that really needs to be done is updating tables, fetching pandas DataFrames, and building dashboards.
Other ETL Systems
There are a handful of ETL management systems out there, such as AWS Glue, Apache Airflow, and dbt, each with their own perspectives on the ETL process. Airflow, for example, lets data engineers schedule their scripts as Directed Acyclic Graphs (DAGs) and behaves somewhat like crontab with more context. Dbt leans into the Transform side of ETL and offers Jinja-style templating for managing many SQL models. AWS Glue acts as a more comprehensive data integration service between Amazon’s various data store options (RDS, Redshift, S3, etc.).
These tools are promising for large-scale workloads, but in many projects, they can be a bit overkill. In many cases, the setup and boilerplate involved with these industry tools lead to a clunky user experience. You need to conform your ETL jobs to the framework you choose, and a fair amount of background knowledge is required to effectively use these tools.
This is where Meerschaum comes in ― it’s a lightweight time-series ETL management system built with quality-of-life in mind.
You can still use Meerschaum as a component within larger frameworks. Meerschaum gives you tools to build your architecture how you like.
Introducing Meerschaum
Meerschaum is a lightweight, versatile ETL framework for data scientists. For most projects, it comes with sensible defaults in a pre-configured stack (which includes a time-series database and Grafana) so that you can quickly start syncing and analyzing data.
How do I start using Meerschaum?
The Getting Started guide more comprehensively walks through the basics, but the TL;DR is install from PyPI and run the mrsm command (or python -m meerschaum if mrsm isn’t in your PATH).pip install --user meerschaum
mrsm stack up -d db grafana
mrsm
This will drop you into the mrsm shell where you can start building your pipes. The help command can give insight into available actions (e.g. help show pipes), and auto-complete suggestions will guide you when running commands.
Wait, what are pipes?
The core concept of Meerschaum is the pipe, which is basically a table on a database with some metadata on how to update it. For example, because Meerschaum is time-series focused, all pipes require the name of the primary datetime column.
Pipes let you tap into your data streams for analysis:>>> from meerschaum import Pipe
>>> pipe = Pipe('plugin:noaa', 'weather')
>>> df = pipe.get_data(
... begin = '2021-10-01',
... end = '2021-11-01',
... params = {'station': ['KATL', 'KCEU']},
... )
>>>
Can I use Meerschaum without time-series data streams?
Of course, you don’t need to conform to the included time-series model. For example, you can use Connectors as a convenient way to create and organize your database connections:
How are data synced into pipes?
The ETL process happens in the sync command. For sql pipes, syncing consists of executing a generated SQL query to fetch, filter, and insert the newest data (I explore various strategies in my master’s thesis).
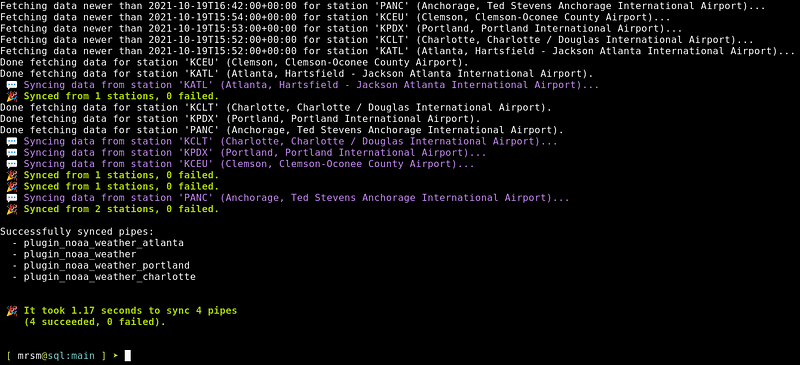
For plugin pipes, the begin and end datetime bounds are passed along to a fetch() function, and the resulting DataFrame is filtered and inserted. Here is more information about writing a fetch plugin, but below is a basic example:
Enough small talk, let’s get some data flowing!
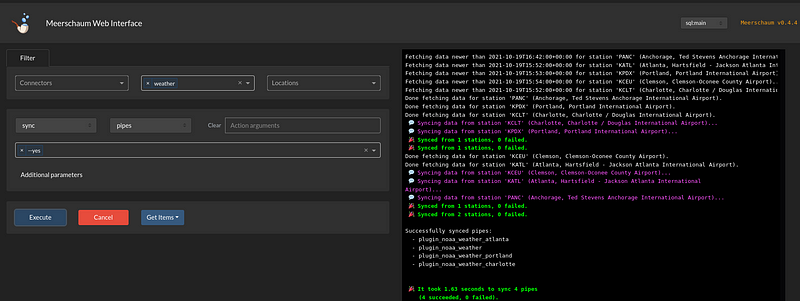
Before we get too deep into the details, let’s sync some data. The Getting Started guide explains things more thoroughly than what I can address here, but if you want to get a feeling for how the process works, run the following commands to get data flowing (you can omit mrsm if you’re in the interactive shell):### Start the database.mrsm stack up -d db grafana
### Install the NOAA plugin.mrsm install plugin noaa
### Register the pipe (or run `bootstrap` for a wizard).
### The -c stands for 'connector' and -m for 'metric'.mrsm register pipe -c plugin:noaa -m weather
### The 'noaa' plugin will ask you for a station. Enter 'KCLT'.
### It also handles the datetime column name.mrsm sync pipes
### Demonstrate that we've successfully synced our data.mrsm show data
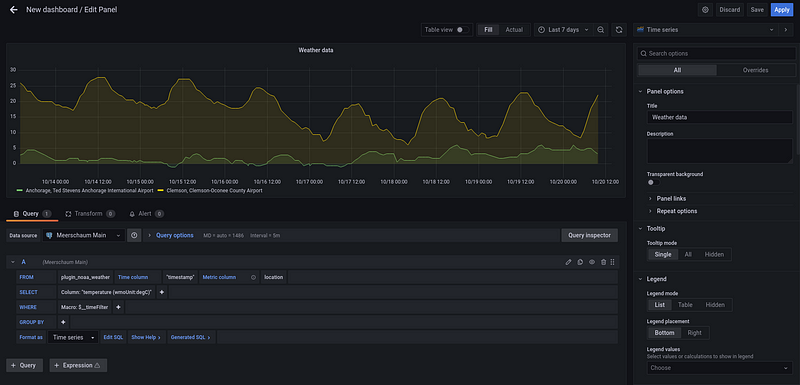
Visit http://localhost:3000 to see your data in Grafana (default username and password is admin and admin).
The mrsm shell comes with useful commands, such as the show action (e.g. show pipes, show rowcounts, show columns, etc.).
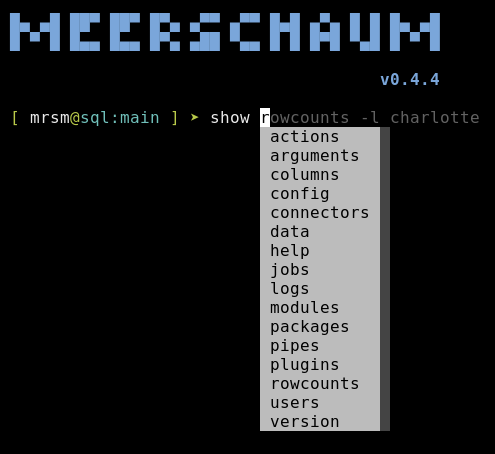
Another useful action for data scientists is the sql command. Meerschaum sql connectors are integrated with the tools from the dbcli project so you can hop into your database without starting an entire IDE.

Building Pipes
If you are looking to extract data from a relational database, add the connection with bootstrap connector, then build the pipe with bootstrap pipe. The bootstrap command starts a wizard to guide you through adding connectors and pipes.
When bootstrapping a pipe with a sql connector, the wizard will prompt you to enter a SQL definition as if the pipe were a view (you can edit the definition later with edit pipe definition). This definition is later used in a larger query to bound on the datetime axis when fetching new data.
Syncing Pipes
As mentioned above, the sync pipes command fetches, filters, and inserts new data into your pipes. Various flags affect the behavior or the syncing process, such as the following:
- The
--loopflag continuously syncs pipes, sleeping 1 second between laps. - The
--min-secondsflag changes the number of seconds between laps. - The
-dor--daemonflag runs the command as a background job and may be applied to any Meerschaum command. - The standard
-c,-m, and-lpipe filter flags specify which pipes may be synced. Multiple values are accepted per flag.
For example, the following command would continuously sync pipes with the connector keys plugin:noaa and wait one hour between batches, all in a background job.sync pipes -c plugin:noaa --loop --min-seconds 3600 -d

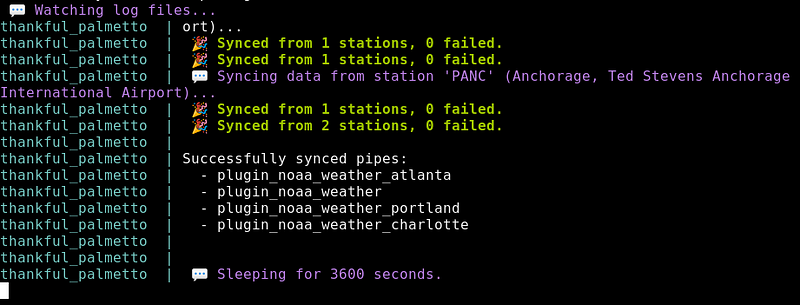
Using Meerschaum in Your Projects
Below are examples of ways Meerschaum can help you in your project. You can follow the models of the framework, but Meerschaum gives you the flexibility you need to build your architecture how you like.
Plugins
You can include your scripts in your Meerschaum instance via plugins, which are simple Python scripts. Plugins can fetch data, define custom sync behavior, extend the built-in FastAPI app, and add or override actions and flags.
To share your plugins, you can upload to the default public Meerschaum repository or your own private Meerschaum API instance with -r.register plugin myplugin -r api:myinstance
In an article I wrote earlier this year, I demonstrated a Meerschaum plugin I wrote to fetch financial data from the Apex Clearing API.
The Web API
You can connect to your Meerschaum instance and protect your database behind a firewall by running the Web API.start api -d
On another machine, add your API as a connector and use it to access your instance (with the instance command in the shell or the -i flag on commands). The web dashboard is available to control Meerschaum through the browser.
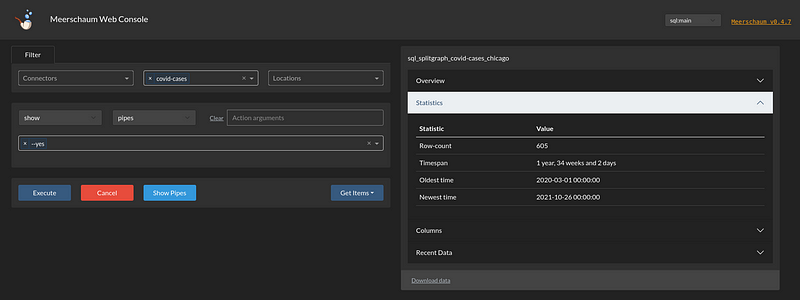
The API lets you collaborate with a team, hosting private plugins and allowing separate Meerschaum user logins. Note that as of now, users share the database, so the users system is intended for smaller teams per specific instance. That is, plugins are owned by users, and pipes are shared amongst the team.
A complete architecture might include many Meerschaum instances.
Shell Commands
You may use Meerschaum in shell scripts or crontab with mrsm or python -m meerschaum. Note that you need to pass -y or -f so that your scripts won’t get hung up on the interactive questions.### Sync pipes once per hour.
0 * * * * python -m meerschaum sync pipes### Start jobs on reboot
@reboot python -m meerschaum start jobs -y
Background Jobs
For continuous actions (like running the API), Meerschaum background jobs are an easy way to manage processes. Add the -d flag to tell Meerschaum to run the command you specified as a background job. Jobs are given random names unless you specify the --name flag.mrsm start api -d --name api_job
You can manage your jobs with the start, stop, and delete commands. The command show logs will show the output of running background jobs (like docker-compose).
Python Package
The meerschaum Python package may be easily imported into your existing scripts. The complete package documentation goes into greater detail, though below are several useful examples.
A Pipe object lets you access your data streams directly. The sync() method allows us to add new data into the pipe (filtering out duplicates), and the get_data() method lets us easily retrieve historical data according to specific parameters. Here’s the documentation on things the Pipe object is capable of.
The get_pipes() function lets you retrieve all of the registered pipes on an instance.
Conclusion
This article shows a couple ways you can start syncing your time-series data, though Meerschaum has a lot more to offer. Remember, the primary focus of Meerschaum is quality-of-life so that you can get back to data analysis. To data scientists who don’t have time to fuss with data engineering: Meerschaum might be right for you!
So, what are you waiting for? Give it a shot! Try using the built-in SQLite instance sql:local and syncing some data.
I started Meerschaum to make data engineering accessible to everyone, so I’m available at project discussion page on GitHub if you need help, have ideas, or want to show what you’ve built!
